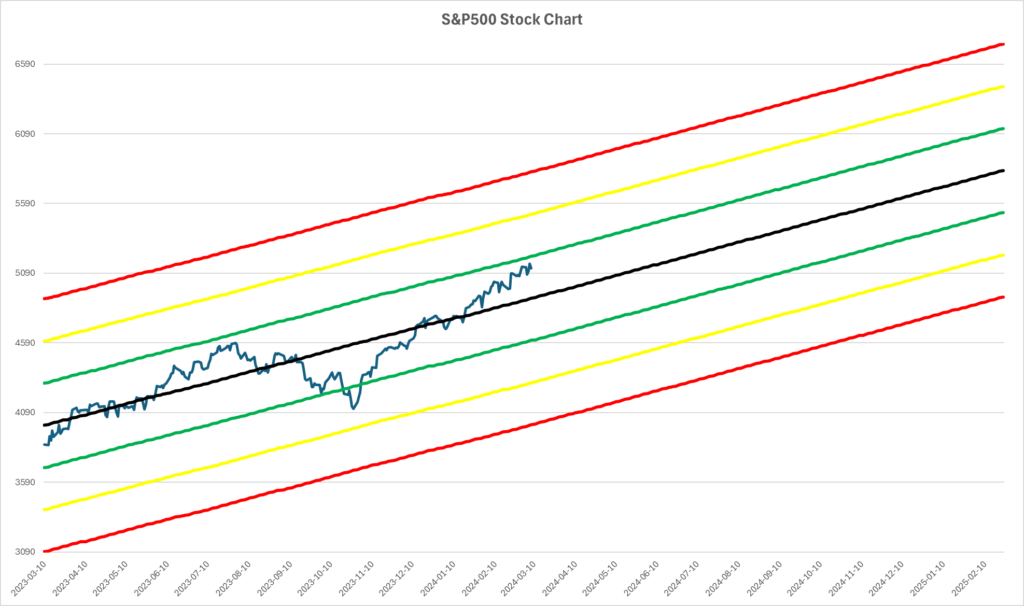
The S&P500 continues to run strong hovering just shy of the +1 stdev line which it has not crossed over the past 365 trading days.
US stock market indices closing prices:

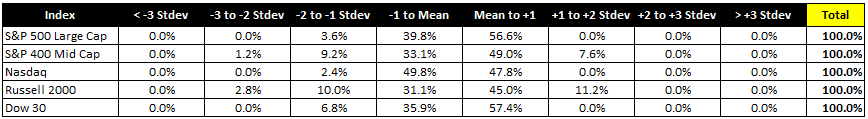
US stock market indices % of trading occurrences by stdev over L12 months:
S&P 500 # of stocks by stdev by trend over L12 months:

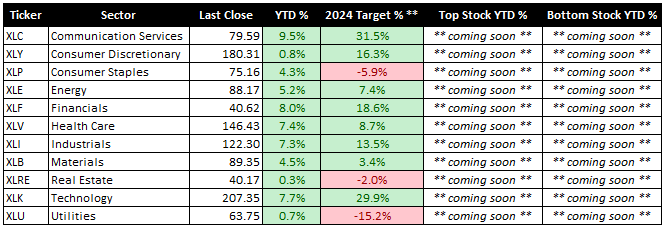
Closing prices for the S&P500 market sectors:
Stocks outside stdev outer bounds:
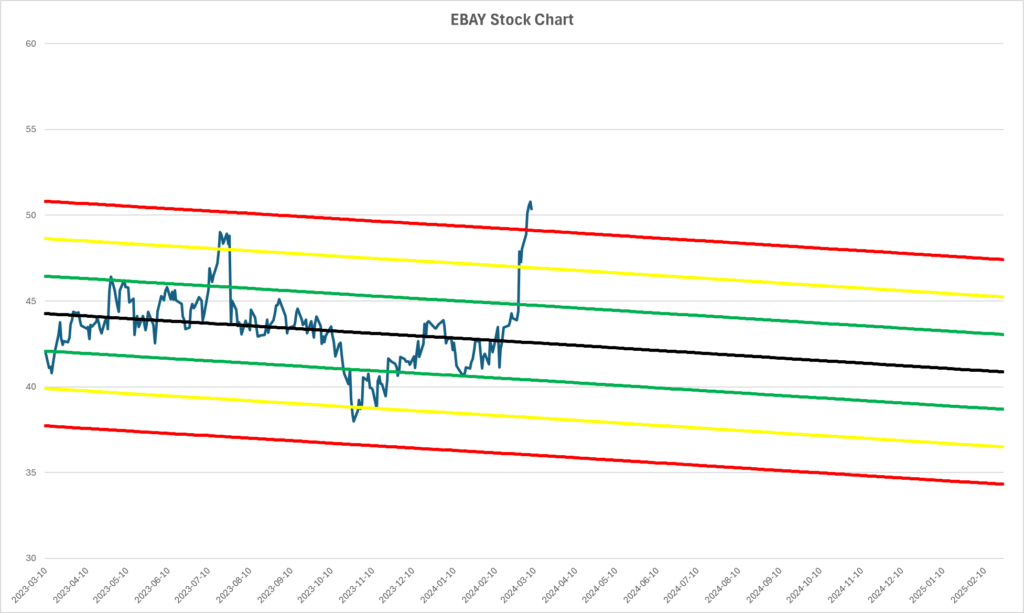
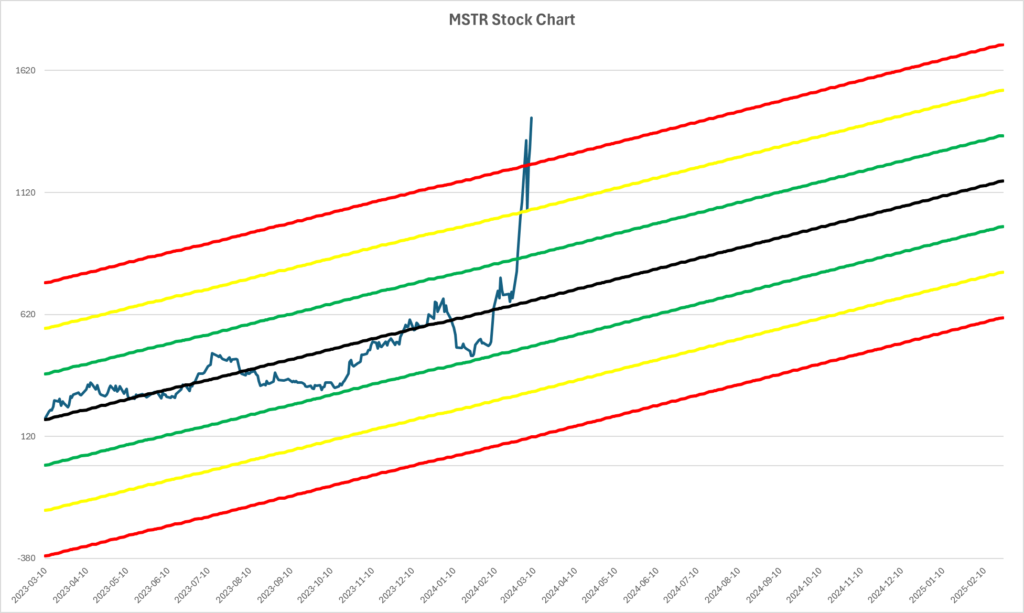
- Above +3 stdev: EBAY; MSTR
- Below -3 stdev: None
Stocks almost at stdev outer bounds:
- Between +2 to +3 stdev: TMO; DIS; TGT; HCA; EW; AZO; A; YUM; OTIS; GEHC; TSCO; DOV; IEX; CINF; TRMB; CRL; MHK; MGEE; SMCI
- Between -2 to -3 stdev: CHTR; UNH
Stocks running strong (trending upwards & above -1 stdev):
- Number of stocks: 65 / 503 (+14 vs. Last week)
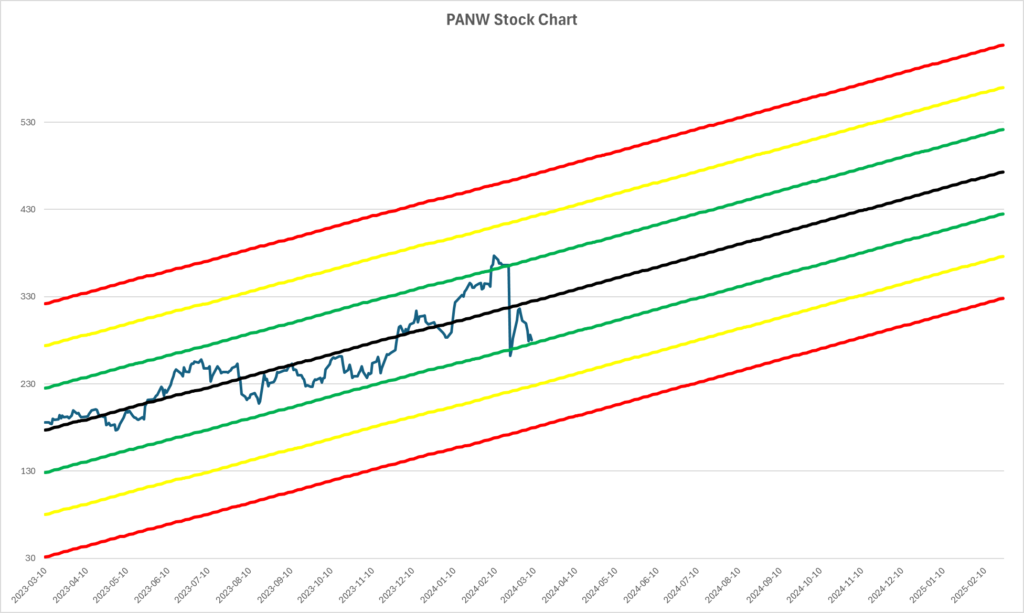
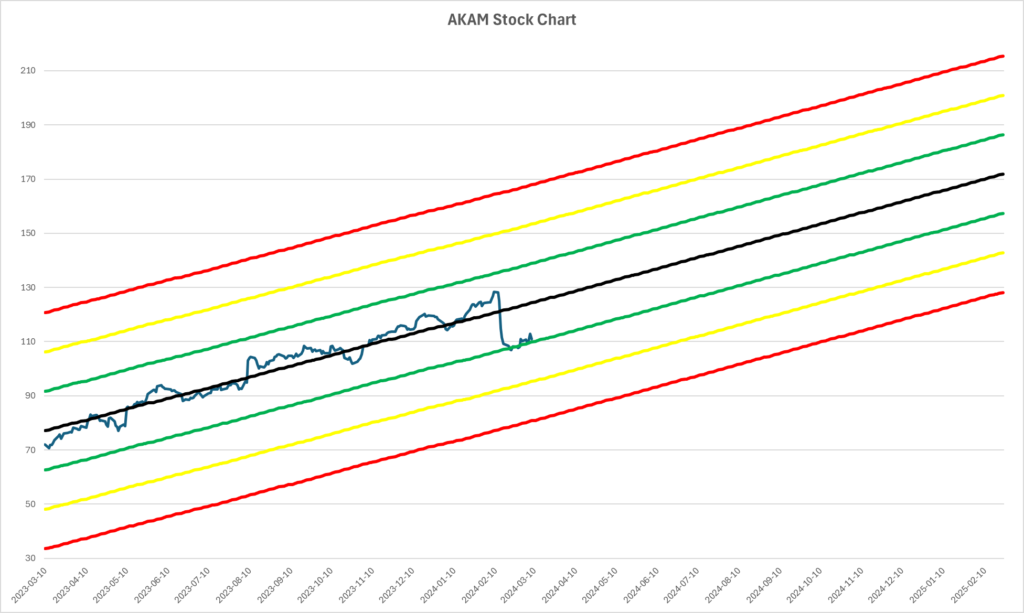
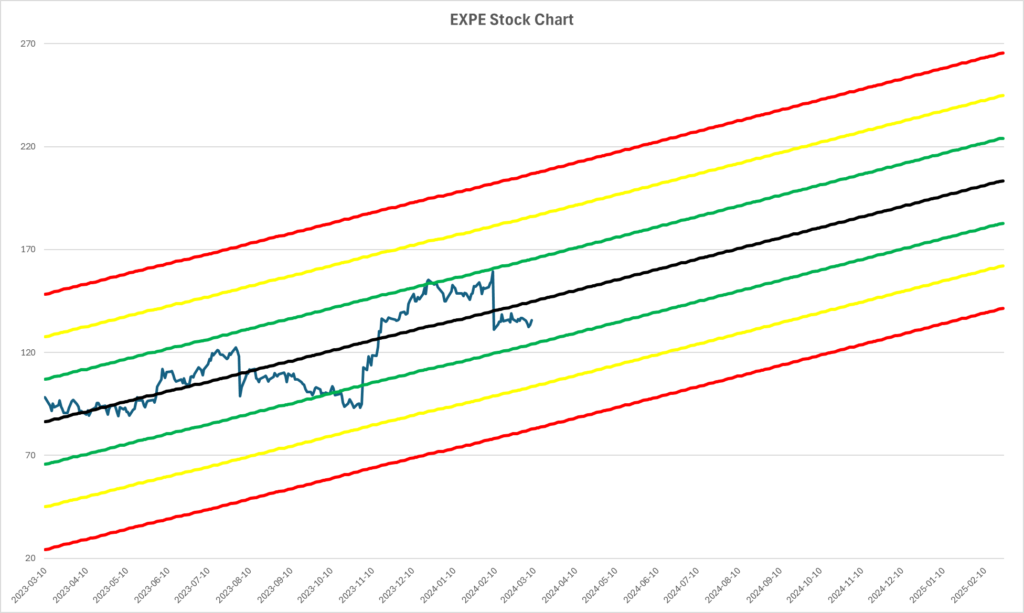
- Within this group, the top 5 stocks ranked by highest potential return (2024 target ** / last close): PANW (+68.8%); AKAM (+58%); EXPE (+53.6%); NOW (+48.9%); INTC (+48.2%)
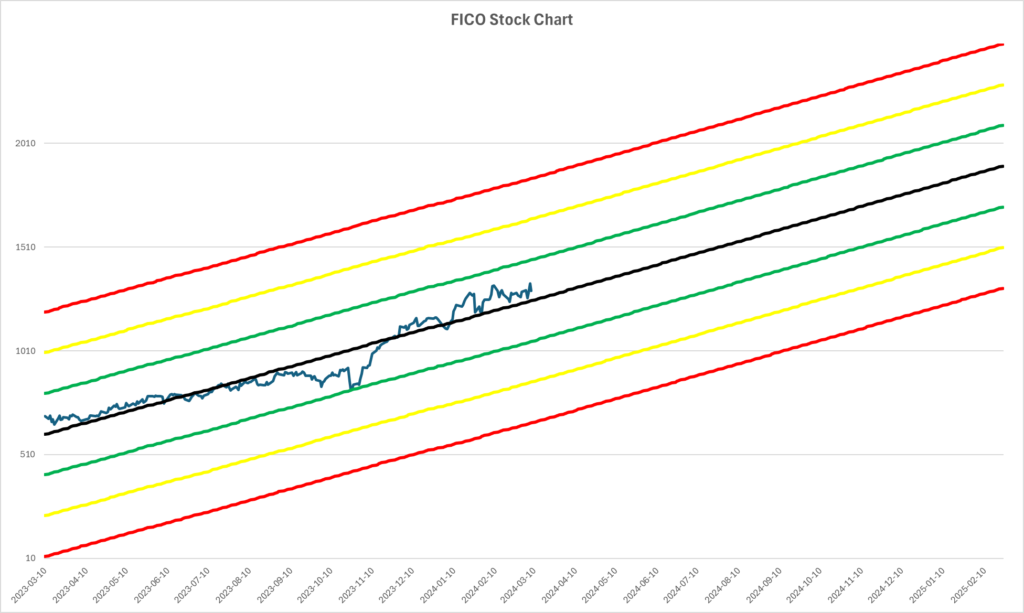
Top 5 stocks ranked by highest potential return (2024 target ** / last close) regardless of stdev placement:
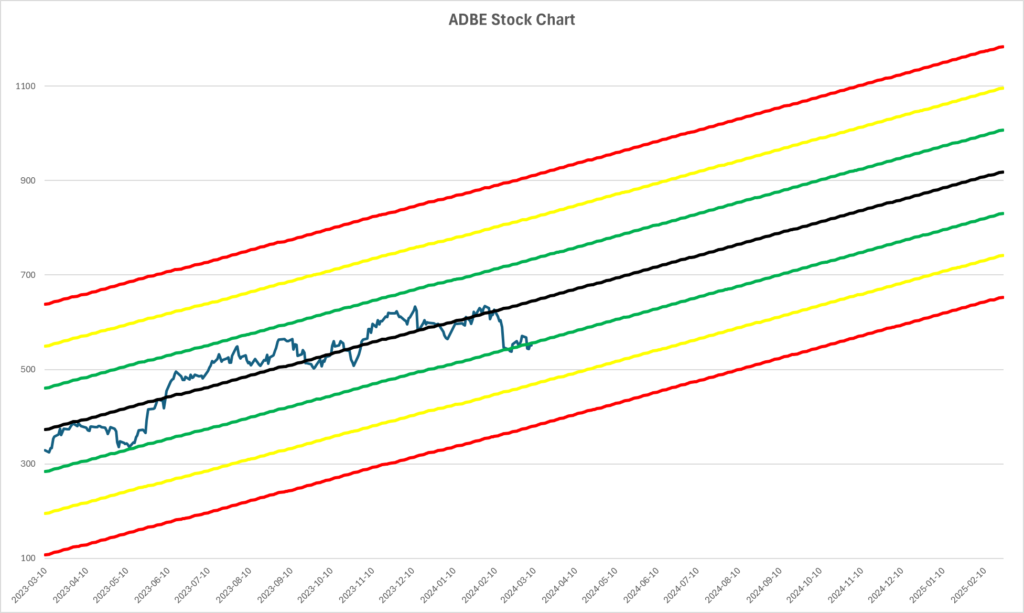
- ADBE (+70.5%); PANW (+68.8%); AKAM (+58%); EXPE (+53.6%); FICO (+49.8%)
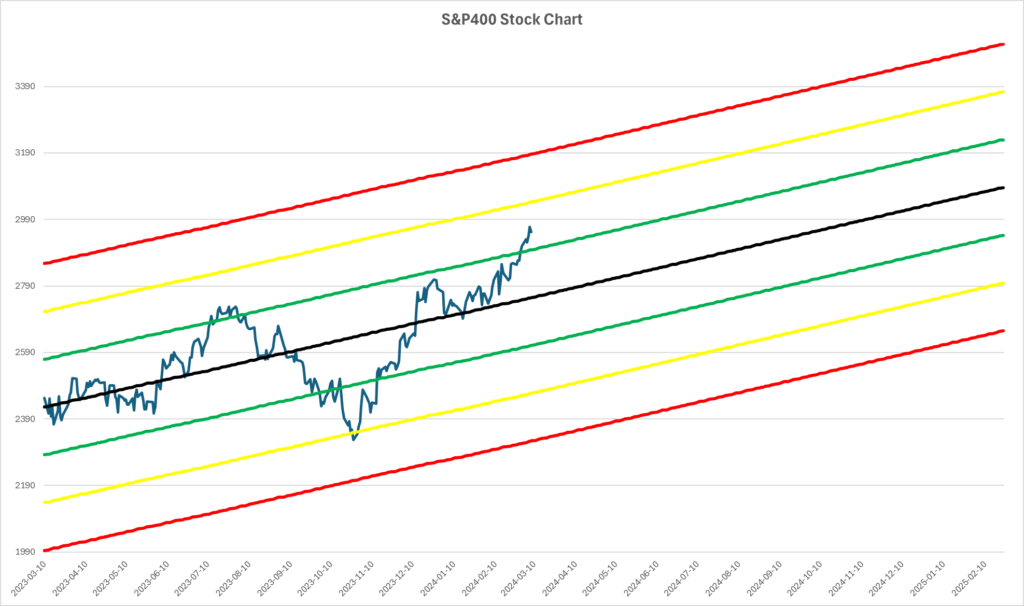
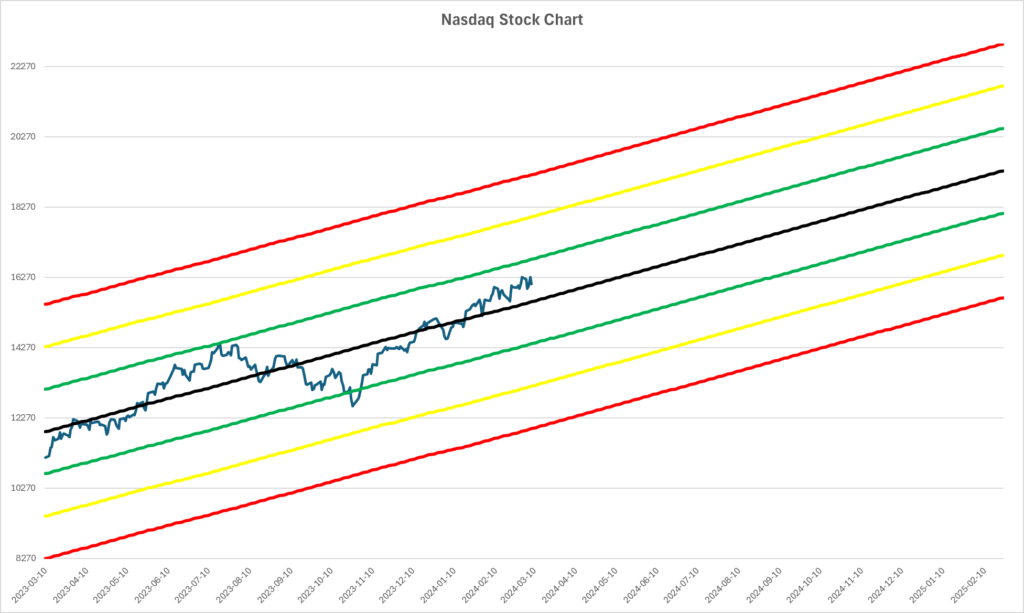
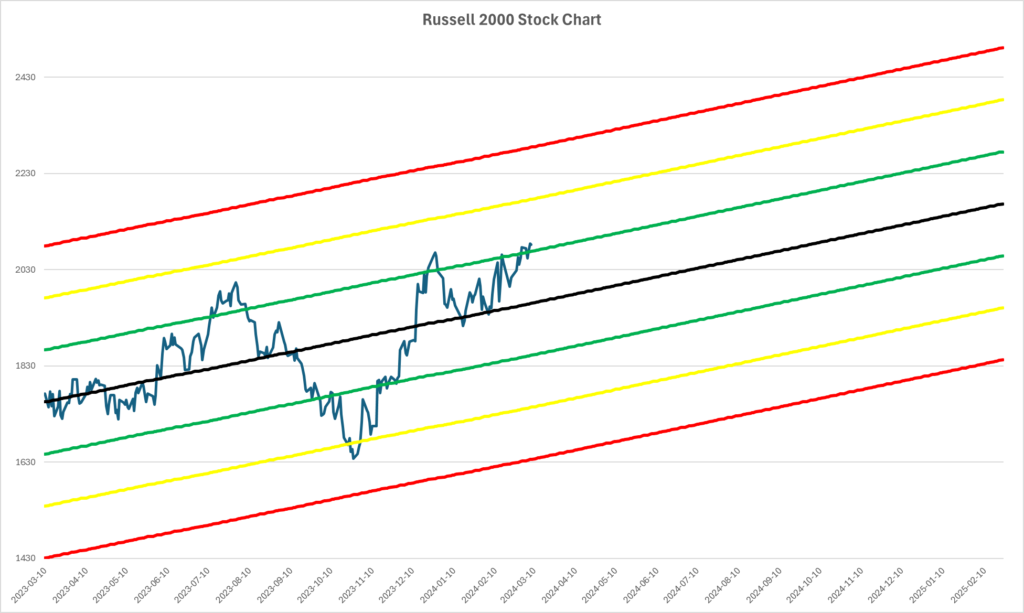
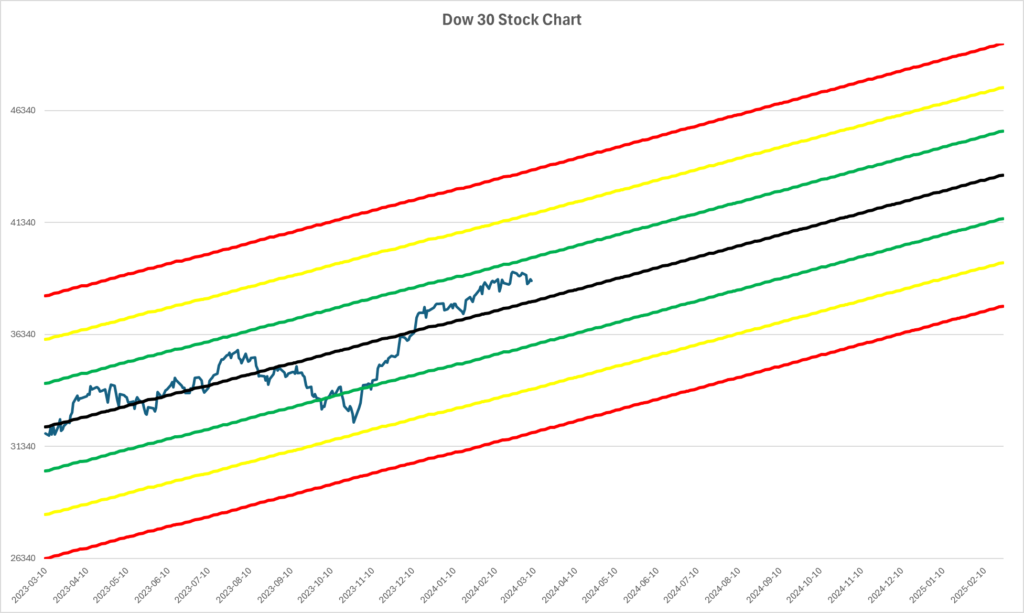
US indices charts
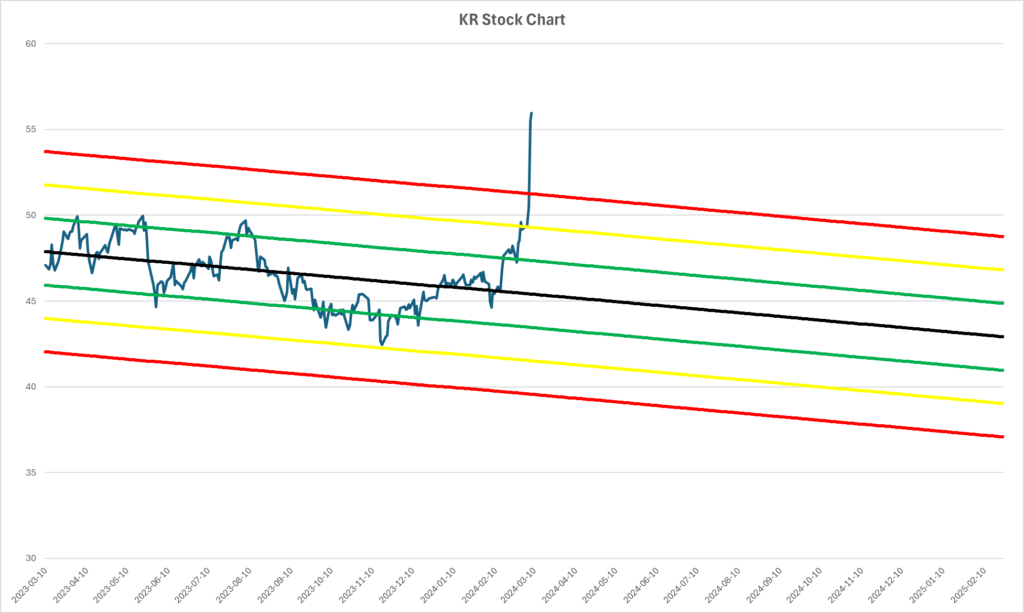
Noteworthy stock charts
Notes:
- ** 2024 Target % does not indicate guaranteed returns. The 2024 target price is determined by extending trendlines based on the L12month closing prices. The % return is calculated as 2024 target / 2023 closing price.
- Stdev data represents L12month closing price activity.
- Content, charts, symbols, references to returns are for educational purposes only and do not imply investment advice or a recommendation or solicitation to buy, sell, or trade a security or stock.