There are 9 stock callouts for this week: GEHC; EBAY; ADBE; AKAM; INTC; RCL; CCL; PANW; EXPE
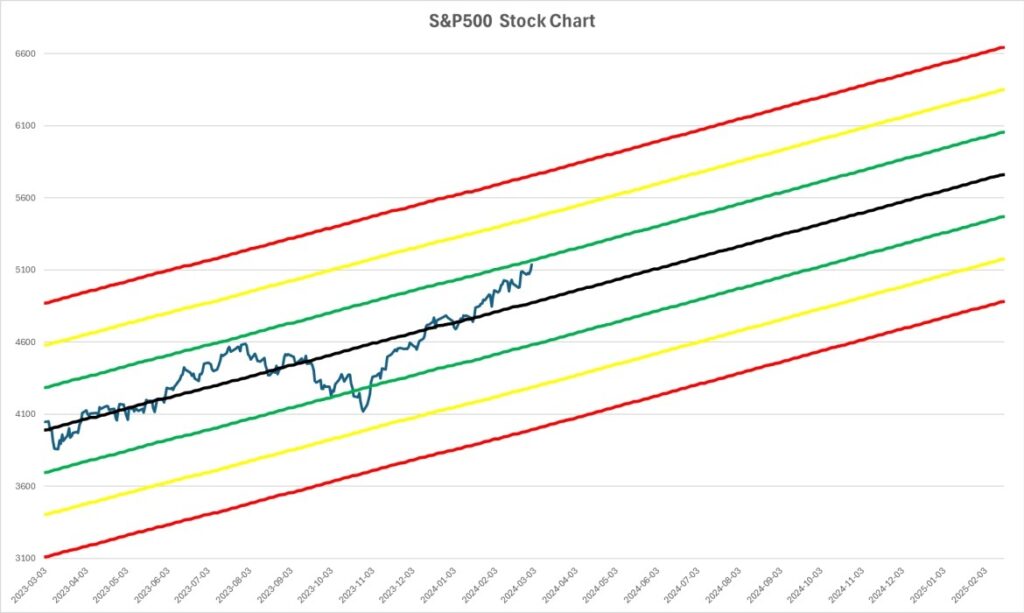
The S&P500 continues to run strong and is approaching the +1 stdev line which it has not crossed over the past 365 trading days. Extending the trend 365 days out puts the S&P500 mean at 5,761.88 (+12.2%).
S&P500 stdev placement of last 365 days trading occurrences:
- Between Mean to +1 stdev: 56.6%
- Between -1 stdev to Mean: 39.8%
- Between -2 to -1 stdev: 3.6%
A closer look at the 503 components within SPY (SPDR S&P 500 ETF Trust):
- % of S&P500 stocks in an Up trend: 64%
- % of S&P500 stocks in a Down trend: 36%
| Trend | < -3 Stdev | -3 to -2 Stdev | -2 to -1 Stdev | -1 to Mean | Mean to +1 | +1 to +2 Stdev | +2 to +3 Stdev | > +3 Stdev | Total |
|---|---|---|---|---|---|---|---|---|---|
| Up | 0 | 1 | 14 | 62 | 145 | 83 | 13 | 0 | 318 |
| Down | 0 | 0 | 5 | 39 | 93 | 34 | 8 | 2 | 181 |
| Total | 0 | 1 | 19 | 101 | 238 | 117 | 21 | 2 | 499 |
Stocks outside stdev outer bounds:
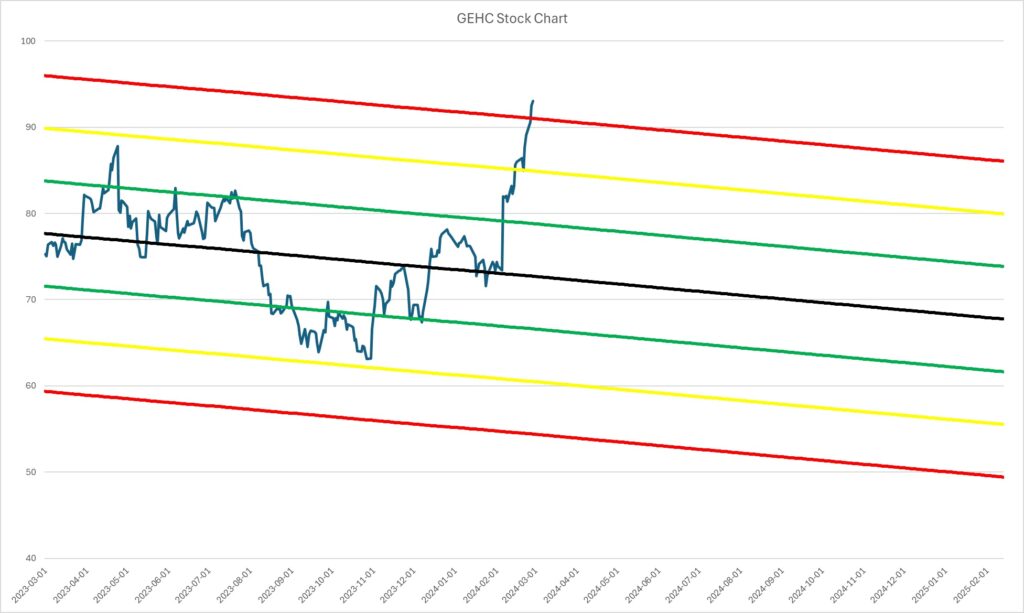
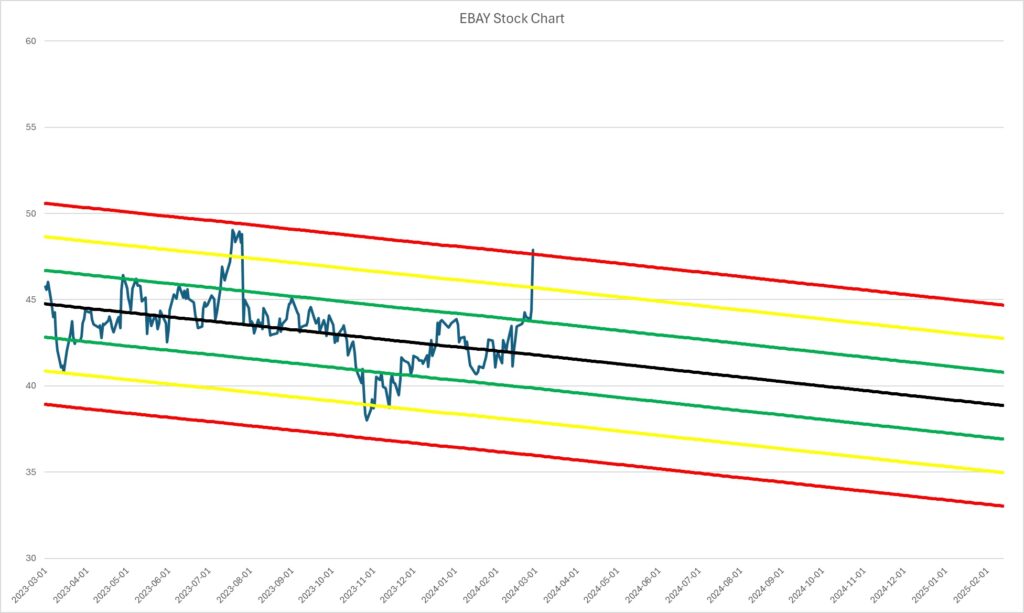
- Above +3 stdev: GEHC; EBAY
- Below -3 stdev: None
Stocks almost at stdev outer bounds:
- Between +2 to +3 stdev: MRK; DIS; AXP; SYK; WM; AZO; IQV; CEG; YUM; CMI; KR; DFS; ULTA; TSCO; DOV; AXON; IEX; TRMB; CRL; TPR; RL
- Between -2 to -3 stdev: CHTR
Stocks reliably grinding it out higher:
- Number of stocks in a an uptrend and holding above their -1 stdev line: 51 / 503
- The top 5 of these 51 stocks ranked in order of highest potential return: FICO (+48.6%); NOW (+46.5%); GOOG (+43.1%); LLY (+42.7%); JBL (+42.6%)
Top 5 stocks with highest potential return:
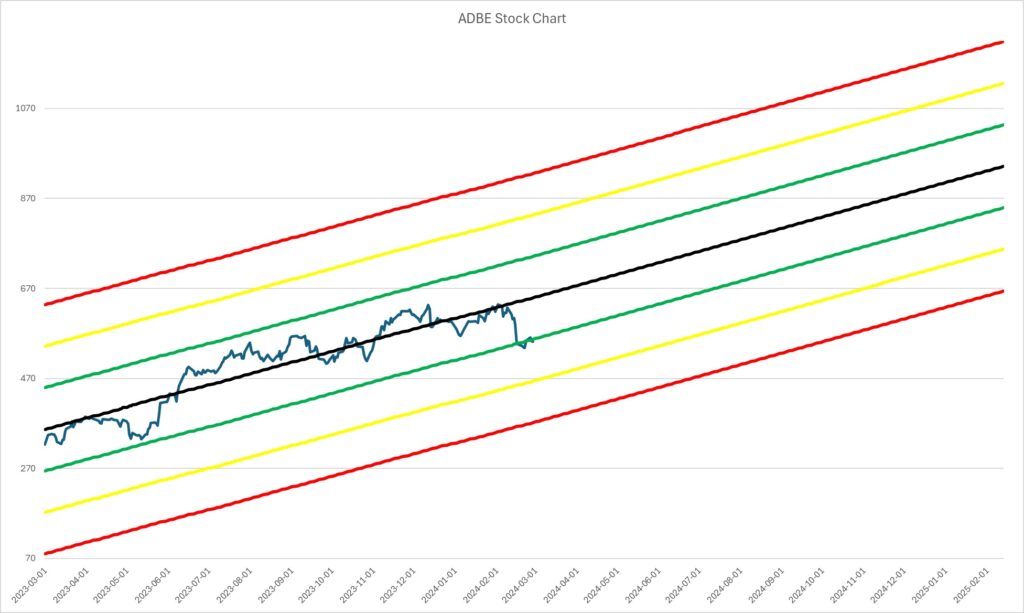
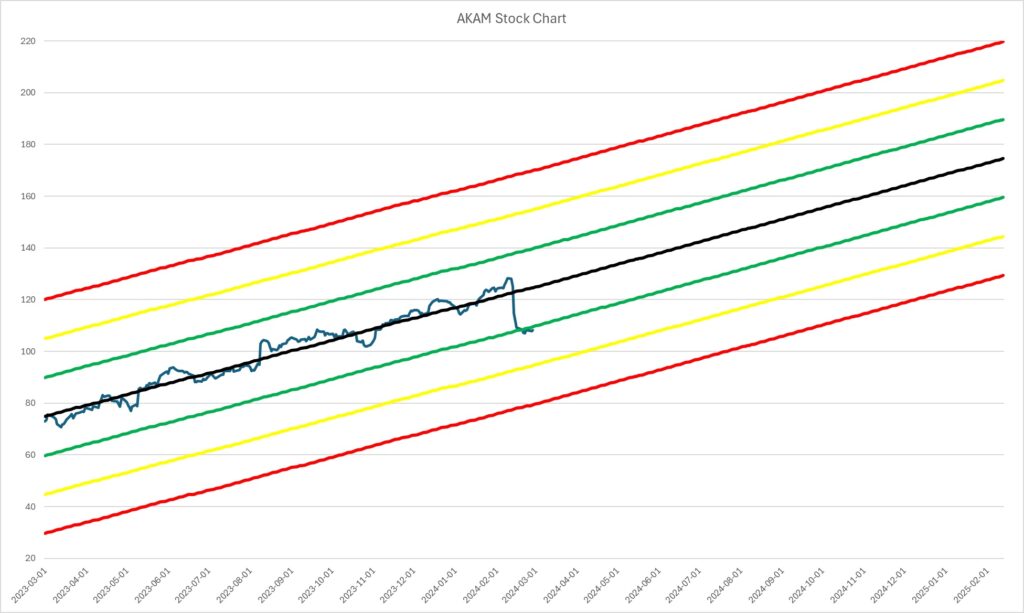
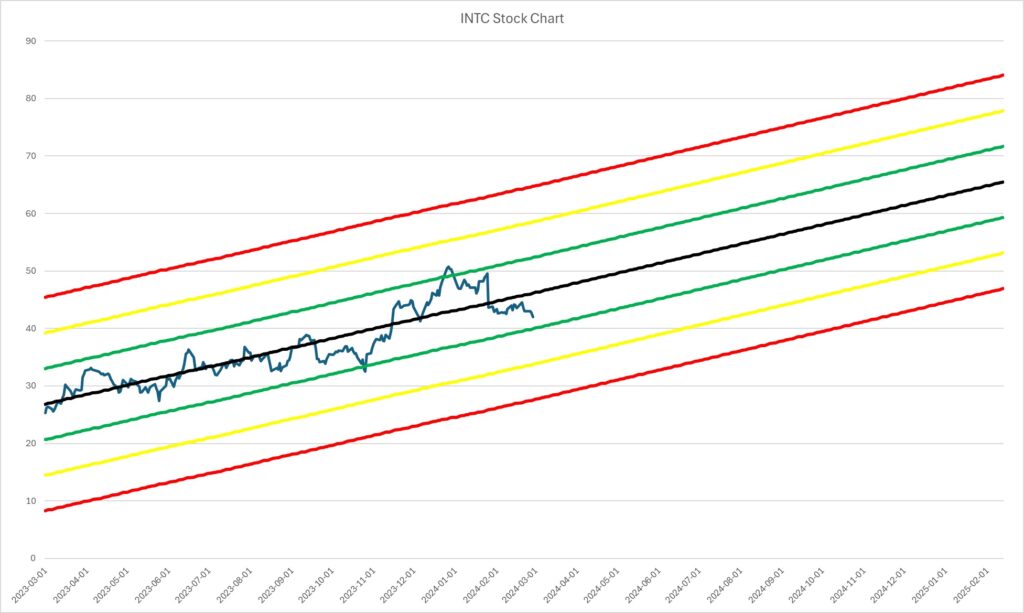
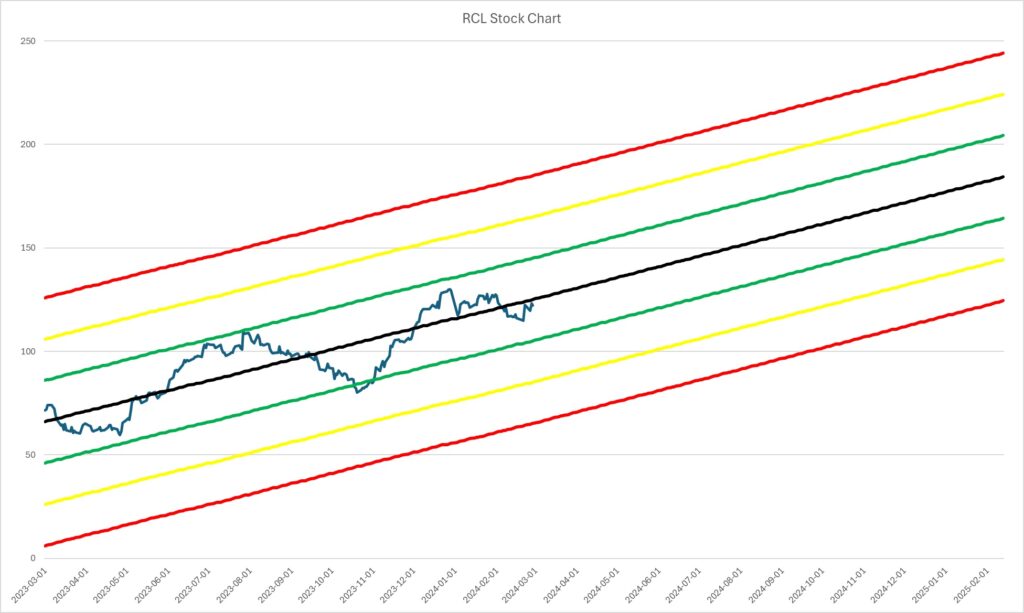
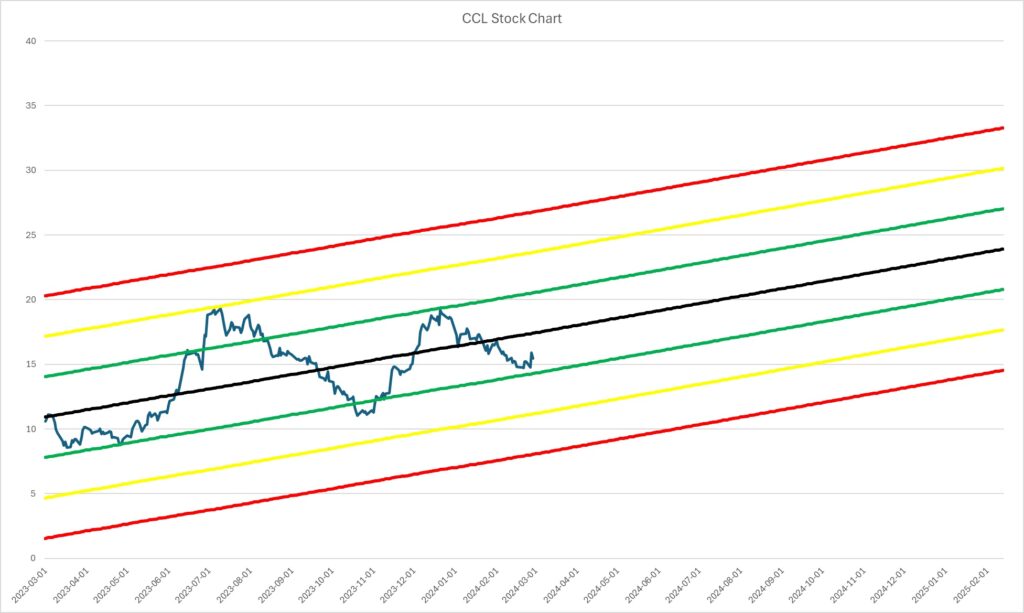
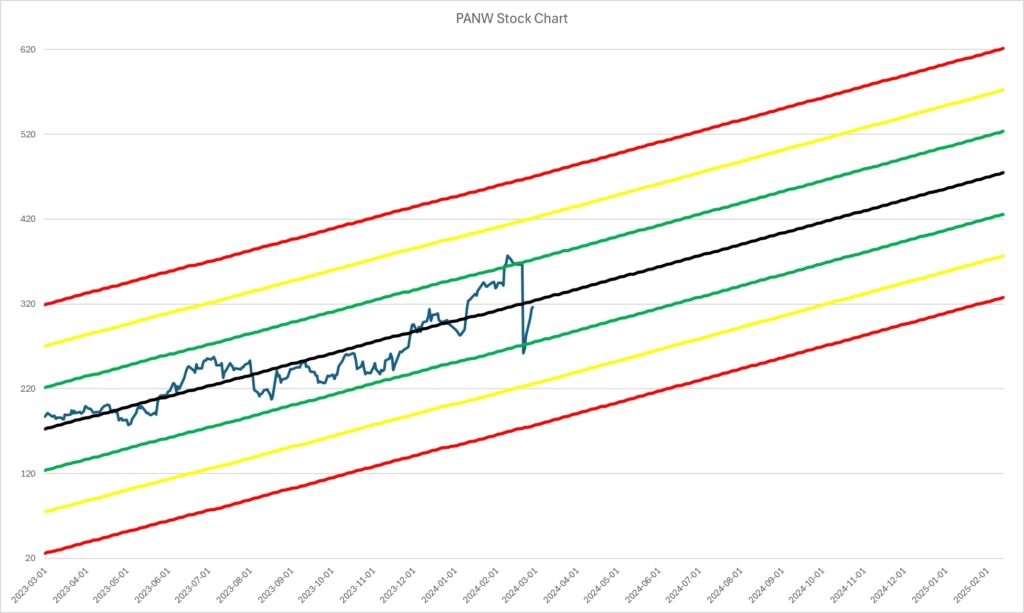
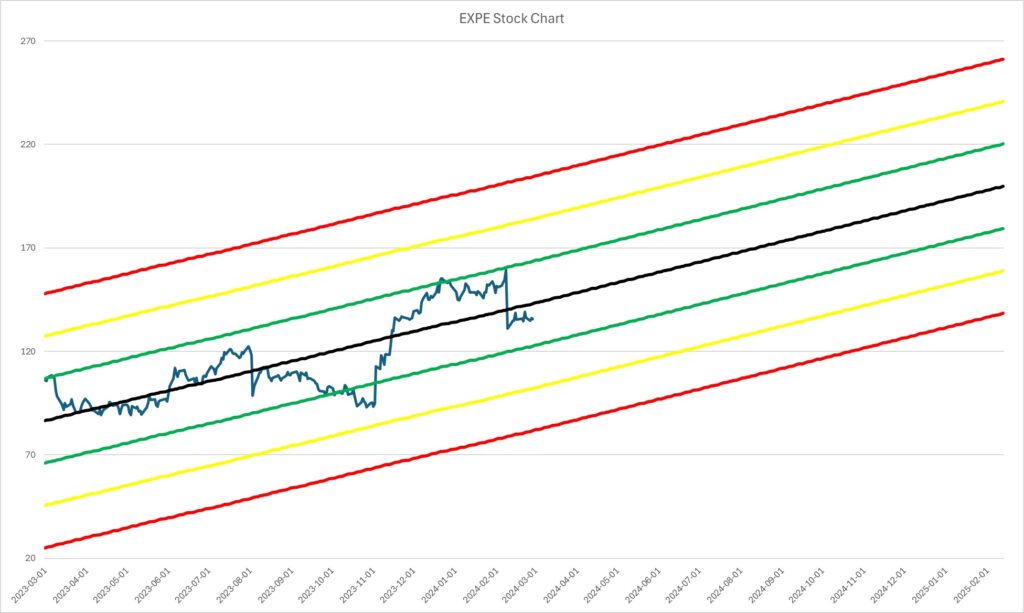
- Top 5 stocks regardless of stdev placement ranked in order of highest potential return: ADBE (+70.6%); AKAM (+65%); INTC (+56%); RCL (+55.1%); CCL (+54.6%); PANW (+54%); EXPE (+51.3%)
Noteworthy charts
**Note: All stats mentioned above are based on last 365 days trading history & potential returns based on extended trendline projections 365 days out from current point in time. Do you own due diligence prior to making your investing decisions.